
Financials are the scorecard for your business’ performance
 You need to speak the investors’ language and you need to understand your business’ financials, but you should not have to become a chartered accountant or financial analyst to do so.
Don’t get tripped up by investor questions during your pitch or run out of cash because you can’t interpret your financials.
This blog post provides a brief introduction to the ‘big 3’ financial statements (Income Statement, Balance Sheet and Cash Flow Statement) and what they can tell you about your startup’s financial health. You can learn a lot more on the topic in the Moolman Institute course Financial Modeling for Entrepreneurs 301: How to Understand and Analyze Financial Statements.
What are the Big 3 Financial Statements for?
The 3 main financial statements used to understand and analyze a business’ financials are the Income Statement, the Balance Sheet and the Cash Flow Statement.

The Income Statement tells us about the financial performance of the business over a period of time. Did the company make or lose money over this period?
The Balance Sheet tells us about the financial position of the business at a specific point in time. It provides a snapshot of the business’ financial health at that point in time.
The Cash Flow Statement is a summary of the cash inflows and outflows for the business over a period of time. Did the business generate or consume cash over this period?
Types of Profit
Before we get to the Income Statement, let’s just make sure that we all understand what “profit” refers to. At the simplest level, profit is the difference between revenue and expenses. It indicates whether a business is making or losing money.
The below diagram summarizes the main types of profit: gross profit, operating profit and net profit.

Gross profit indicates whether the business is making a profit based on the direct costs of whatever the company sells.
Operating profit includes all other operating expenses (such as general company overheads, building leases etc.) and indicates whether a profit is made when all these other costs of running the business are included. (It is often referred to as EBITDA, or Earnings before Interest, Tax, Depreciation and Amortization.)
This is a better indicator of the business’ financial performance than either gross profit or net profit, since it includes all income & expenses relating to the operation of the business but excludes non-operational items.
Net profit includes all non-operating income & expenses, such as interest on loans or income from investments.
The Income Statement
The Income Statement looks at performance or profitability of the business over a period of operation. Below is the typical layout of an Income Statement with a description of what each component means.

The Balance Sheet
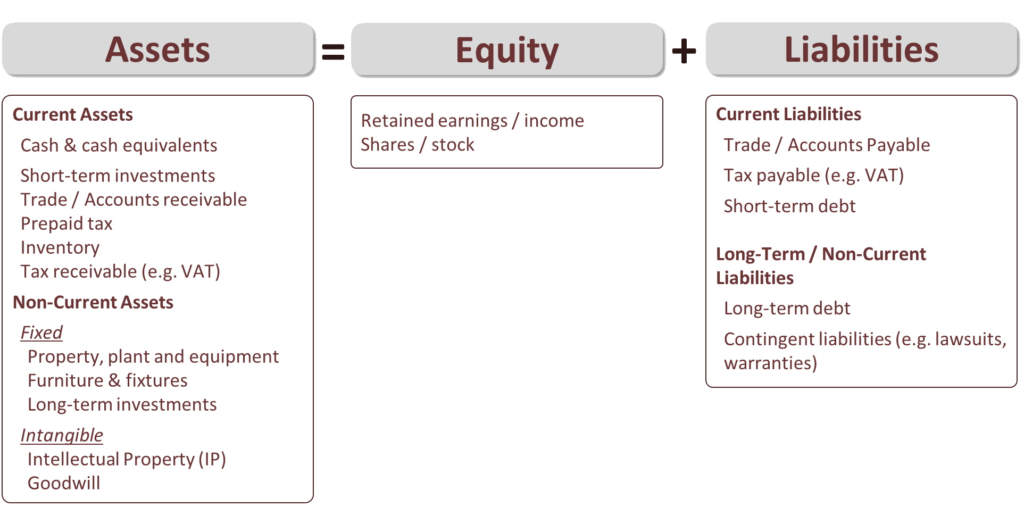
The Balance Sheet looks at the financial position of the business at a specific point in time. Specifically, it looks at the Assets, Equity and Liabilities of the business and is structured according to the well-known equation A = E + L (Assets = Equity + Liabilities).
It always has to balance (hence the name  ), since the two parts are inextricably linked.
The Equity and Liabilities categories tell us about the sources of funds. Did the business raise funds through issuing shares? Did it borrow money? Did it make profits in previous years or did operations consume funds?
The Assets category tells us about the uses of funds (how the funds have been used or applied). Did the company invest in property, plant and equipment? Did it buy intellectual property? Did it invest in other businesses? Is it sitting on a pile of cash?
The below diagram shows some of the typical components of each of the three categories Assets, Equity and Liabilities.
The Cash Flow Statement
The Cash Flow Statement looks at how and whether the company generated cash over a specified period of time. A healthy cash flow is the lifeblood of any business and can be especially tough on startups.
A business might be making a profit on paper (Income Statement) whilst consuming cash (Cash Flow Statement). This is the typical situation for growing businesses (which your startup is hopefully doing!) since expenses have to be incurred before the products and services can be billed to the customer. The faster you grow, the more money you need to spend to keep up. This is the origin of the phrase “growing bankrupt”.
Thus, it is critical to keep an eye on your startup’s cash flow. The Cash Flow Statement will help you do exactly this.
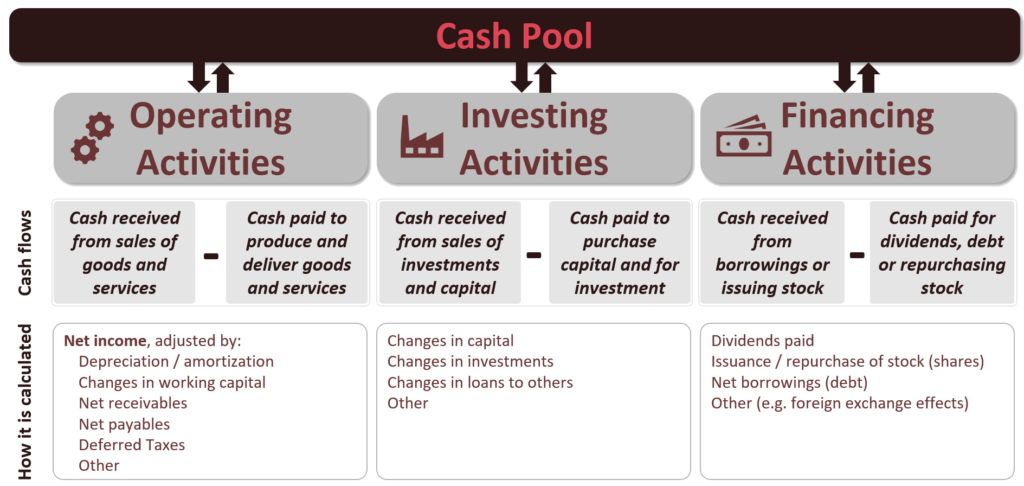
There are 3 categories of activities that generate & consume cash. These are: Operating Activities, Investing Activities and Financing Activities.
The below diagram shows the typical components of a cash flow statement.
Analyzing your Startup’s Financial Statements
This is just a brief introduction to analyzing your startup’s financials – please see the Moolman Institute Course “How to Understand and Analyze Financial Statements” for more detail.
There are 3 main types of analysis of financial statements:
- Vertical Analysis – this compares the various Income Statement items as a percentage of revenue
- Horizontal Analysis – this looks at changes in Income Statement line items over time
- Ratio Analysis – this looks at key numbers & ratios across the financial statements. Well-known examples include net margin (net profit as a % of revenue) and inventory days (how many days’ worth of stock the business holds on average).

To learn more about concepts such as profit, markup and margin; direct and indirect costs; fixed and variable costs; unit economics and ratios such as the gearing ratio, current ratio, liquidity index and economic value add (EVA), enroll for the Moolman Institute Course Financial Modeling for Entrepreneurs 301: How to Understand and Analyze Financial Statements.
Recent Comments